 Sell tickets and manage registrations
 View my tickets and registrations
 Sell more tickets through digital marketing
 Add an event calendar to your website
 Find events by location and categories
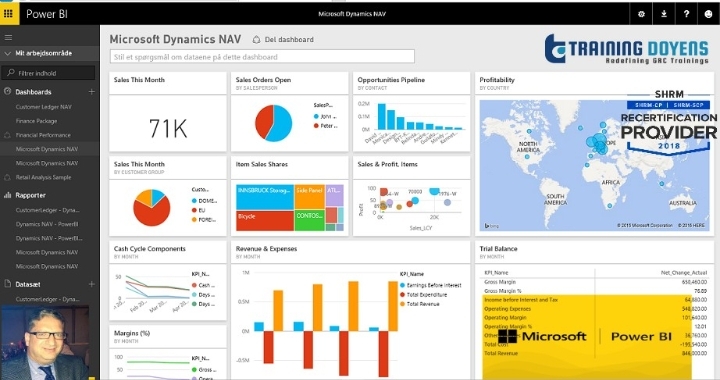
Microsoft Power BI: How to Use Data and Interactive Dashboards to Drive Business Results & Intelligence

OVERVIEW
In today's fast-paced, high-tech, competitive business environment, analytics, data visualization and Business Intelligence (BI) are the hot topics many firms and professional recruiters seek. Increasingly, organizations of all sizes are seeking to take advantage of the vast data available to them to identify previously undiscovered insights and gain competitive advantages. The premier tool for this is
These “big data” desk-top tools were out-of-reach just a few short years ago. Today Microsoft Desktop Power BI is free. The cloud-based Power BI Pro service costs a small business $10 per month and is used by Fortune 1000 firms on an enterprise-wide basis at extremely competitive prices.
Over the last few years, data has become the lifeblood of organizations. Those organizations that harness the power of big data business intelligence (BI) realize tangible competitive advantages. Microsoft Power Business Intelligence allows mangers to rely less on the IT department and achieve more self-service, control, agility and focused business intelligence (BI) using both the data warehouse and outside sources. With MS Power BI you can easily manipulate several databases. MS Power BI is easy, fast, and free.
WHY SHOULD YOU ATTEND
Power BI is a cloud-based business analytics service that gives you a single view of your most critical business data. Monitor the health of your business using a live dashboard, create rich interactive reports with Power BI Desktop and access your data on the go with native Power BI Mobile apps.
AREAS COVERED
Introduction to Power BI Desktop
Downloading the Microsoft Power Bi Desktop for Free
Desktop Summary - Three Different Views and What They Do
An Overview of the Workflow in Power BI Desktop
Dashboard in Minutes - Overview
Loading the Data Model - Connecting Power BI Desktop to Data Sources
Direct Query vs Import Data (Load)
Connecting to Excel Data Sources
Connecting to CSV and text files
Connecting to a Folder of data
Connecting to a web URL
Introduction to the Query Editor Interface: Editing Data
Cleaning up and transforming data
Establishing Headers and Removing rows
Editing and Renaming Rows and Columns
Rearranging columns
Creating custom columns
Trim, Clean and Case
Replacing Values
Splitting columns
Pivoting and Unpivoting Columns
Understanding Database Relationships: Power BI Data Modeling
Modeling with Power BI Desktop
Query Editor vs. Data Model
Formatting Data
Performing Basic Mathematical Operations
DAX: Creating Calculated Columns and Measures
Using time intelligence functions
Formatting Dates
Using the SUMX function
Power BI Desktop Report View: Creating Interactive Visualizations/Dashboards
Walkthrough of Available Charts
Creating Your First Visualizations
Data, Format and Analytics Controls
Creating Column, Bar and Line Charts
LEARNING OBJECTIVES
If you understand Excel charts and Pivot Tables then you can leverage your existing knowledge and skills to create powerful, interactive dashboards and analyses unthinkable until recently. This 100-minute webinar takes you from Excel Dashboards to easier and more powerful MS Power BI dashboards. With this training you’ll learn the basics of implementing "do it yourself business intelligence" using Microsoft Power BI.
WHO WILL BENEFIT
Business owners
CEO's / CFO's / CTO's
Managers of all levels
Anybody with large amounts of data
Anybody who uses Microsoft Access/Excel on a regular basis, and wants to be more efficient and productive
Accountants
CPAs
Controllers
Financial Consultants
IT Professionals
Auditors
Human Resource Personnel
Bookkeepers
Marketers
Admins
Secretaries
For more detail please click on this below link:
Email: support@trainingdoyens.com
Toll Free: +1-888-300-8494
Tel: +1-720-996-1616
Fax: +1-888-909-1882

